BTW ktc, your video claims "over the last century, sea levels have risen about ten inches."
LOL! As I've said all along, Global Warming isn't understood NEARLY well enough to be drawing expensive conclusions. But government proponents have never been too happy about having to know what they're doing before spending money. That might result in . . . COMPETENCE. *shudder*
http://www.appinsys.com/globalwarming/GW_4CE_SeaLevel.htm
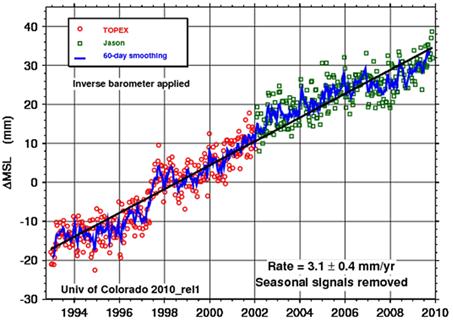
Alarmists say everything is accelerating and itâs worse than expected. But they carefully select start and end dates to create exaggeration. The following figure shows sea level from 1993 through 2009 [http://sealevel.colorado.edu/]. This figure shows a rate of 3.1 mm/year since it starts at a low point in the fluctuating data (the 1993 start indicated by the arrow in the above figure).
The following figure is from a 2006 publication on the EPA website showing the same data as above except through 2005. [http://oaspub.epa.gov/eims/eimscomm.getfile?p_download_id=446967]
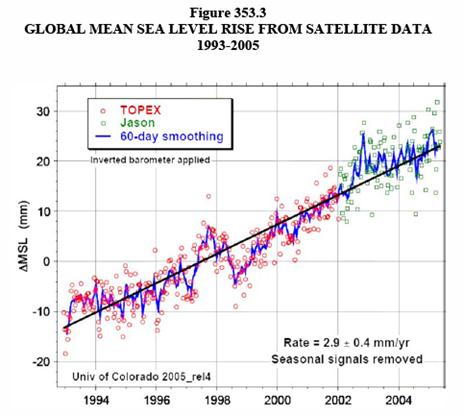
There is a major difference between the above two versions of the same data through 2005 â the older data has more recently been adjusted downwards to increase the apparent rise. The following figure shows the data through 2009 changed to magenta and superimposed on the data published through 2005.

Gold is $1,581/oz today. When it hits $2,000, it will be up 26.5%. Let's see how long that takes. - De 3/11/2013 - ANSWER: 7 Years, 5 Months
