Dec. 28, 2011, 12:01 a.m. EST
Proof that technical analysis works
By Thomas H. Kee Jr.
Marketwatch.com
On December 7th I wrote an article for the Trading Deck titled "Forget Europe and follow your Charts."
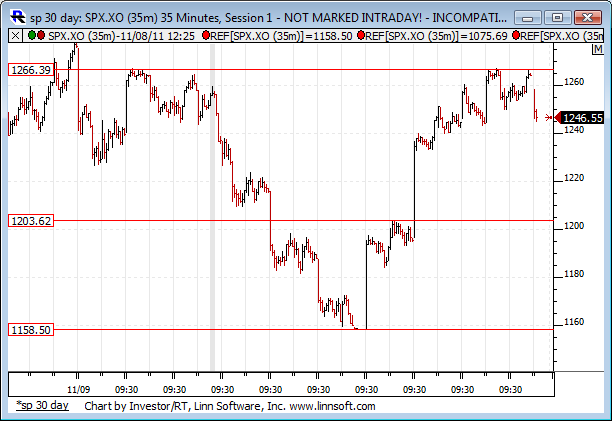
In that article I offered a chart which I think everyone should look at again. The article suggested that the S&P 500 could fall from 1266 to near 1203 (defined in the technical patterns in the chart in the original article), and I recommended four double short ETFs as a result: ProShares UltraShort Dow30, ProShares UltraShort S&P500, ProShares UltraShort Russell2000, and ProShares UltraShort QQQ.

Clearly, based on this chart from the original article, the market fell to 1203, excellent gains were achievable from those short ETFs, and then the Market turned higher (the chart pattern pinpointed the buy-price well in advance). The obvious opportunity for anyone who stopped listening to Europe and who just paid attention to the charts was to short from 1266, take profits when the market fell from there, and then buy again at 1203. That is exactly what we did; we bought four double long ETFs when the market tested those lows: ProShares Ultra Dow30, ProShares Ultra QQQ, ProShares Ultra Russell2000, and ProShares Ultra S&P500. We have already secured 7% from UWM, but we are holding the other double long ETFs with a higher target-sell price; but why didn't we sell all of them?
Full article: http://www.marketwatch.com/story/proof-that-technical-analysis-works-2011-12-28

Gold is $1,581/oz today. When it hits $2,000, it will be up 26.5%. Let's see how long that takes. - De 3/11/2013 - ANSWER: 7 Years, 5 Months
