http://twitchy.com/sarahd-313035/2020/05/27/what-a-load-of-crap-pew-research-center-is-getting-throttled-for-ridiculous-framing-of-covid19-deaths-in-gop-vs-dem-districts-pic/
Sometimes the best way to process information is with a good visual. So thanks, Pew Research Center, for breaking down COVID19 deaths by Democratic vs. Republican districts into this handy graphic:
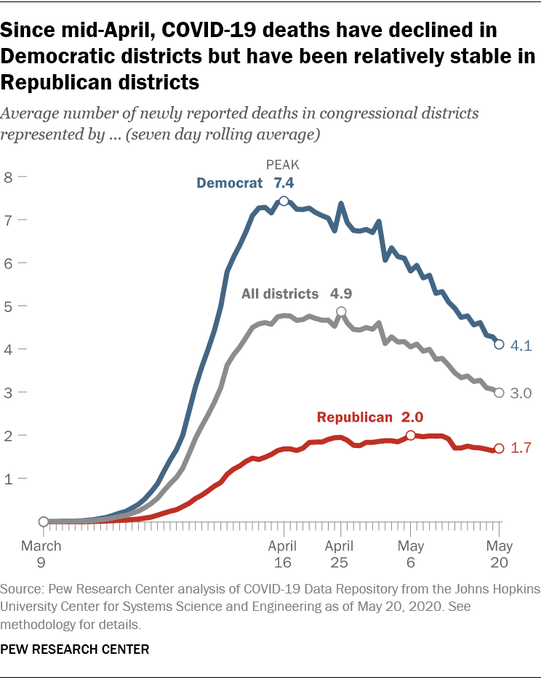
Pew Research Center ~ COVID-19 deaths have declined in Democratic congressional districts since mid-April, but remained relatively steady in districts controlled by Republicans.
Excuse me for a second ... WTF???!!! Methinks "Pew" is aptly named ...

Brigette ~ That's what you get from this?
TFC3Tweets ~ Is that how you read this graph?
Jesse Singal ~ This graphic brought to you by The Commission On Omitted Variable Bias.
John Hayward ~ Turning to the weather, we see rainfall declining much more sharply over the tropics than over the Sahara Desert, which clearly proves global warming is real.
Amy Curtis ~ Wow. Look at the framing here.
Cases in Republican districts were never as high to begin with.
What a load of crap.
Drew Holden ~ When you gotta try extra hard to make the numbers fit your narrative.
Below are the cases by partisanship, absent the commentary.
Varad Mehta ~ Do you people know how to read a chart?
David Taylor ~ Bias is a hell of a drug.
Inez Stepman ~ Both sides dunking on each other about this are stupid.
1) These lines represent your fellow Americans suffering from an illness.
2) The obvious reason for this disparity is that more Democratic districts are urban and got hit first & worse.
Uh ... yeah ... okay ... but ...
Fair points. However:
RBe ~ That's what the tweet from Pew should have said.
But they have a narrative to boost.

The essential American soul is hard, isolate, stoic, and a killer. It has never yet melted. ~ D.H. Lawrence
